debug your Deno programs with VS Code
 2020-04-04
TL;DR — This is a way to debug your Deno programs in VS Code's debugger. It might not be the BEST way, it is just the first working way I found.
Whoooooooooo, Deno 0.39 supports --inspect-brk and that means:
🎉 my life is about to get ♫ awesooooommmme ♪ 🎉
I like, totally stan Deno, and like, watch Ryan Dahl presentations about it when I come home drunk late at night even though I've already seen them.
But, I'm not a masochist, which means I can't use a programming environment for realz unless is has a reasonable debugging story. And for me personally, the minimum bar for reasonableness on that front is some kind of decent GUI debugger with breakpoints. Could be Xcode, Jetbrains IDEA, Chrome/Firefox/Safari dev tools — anything like that.
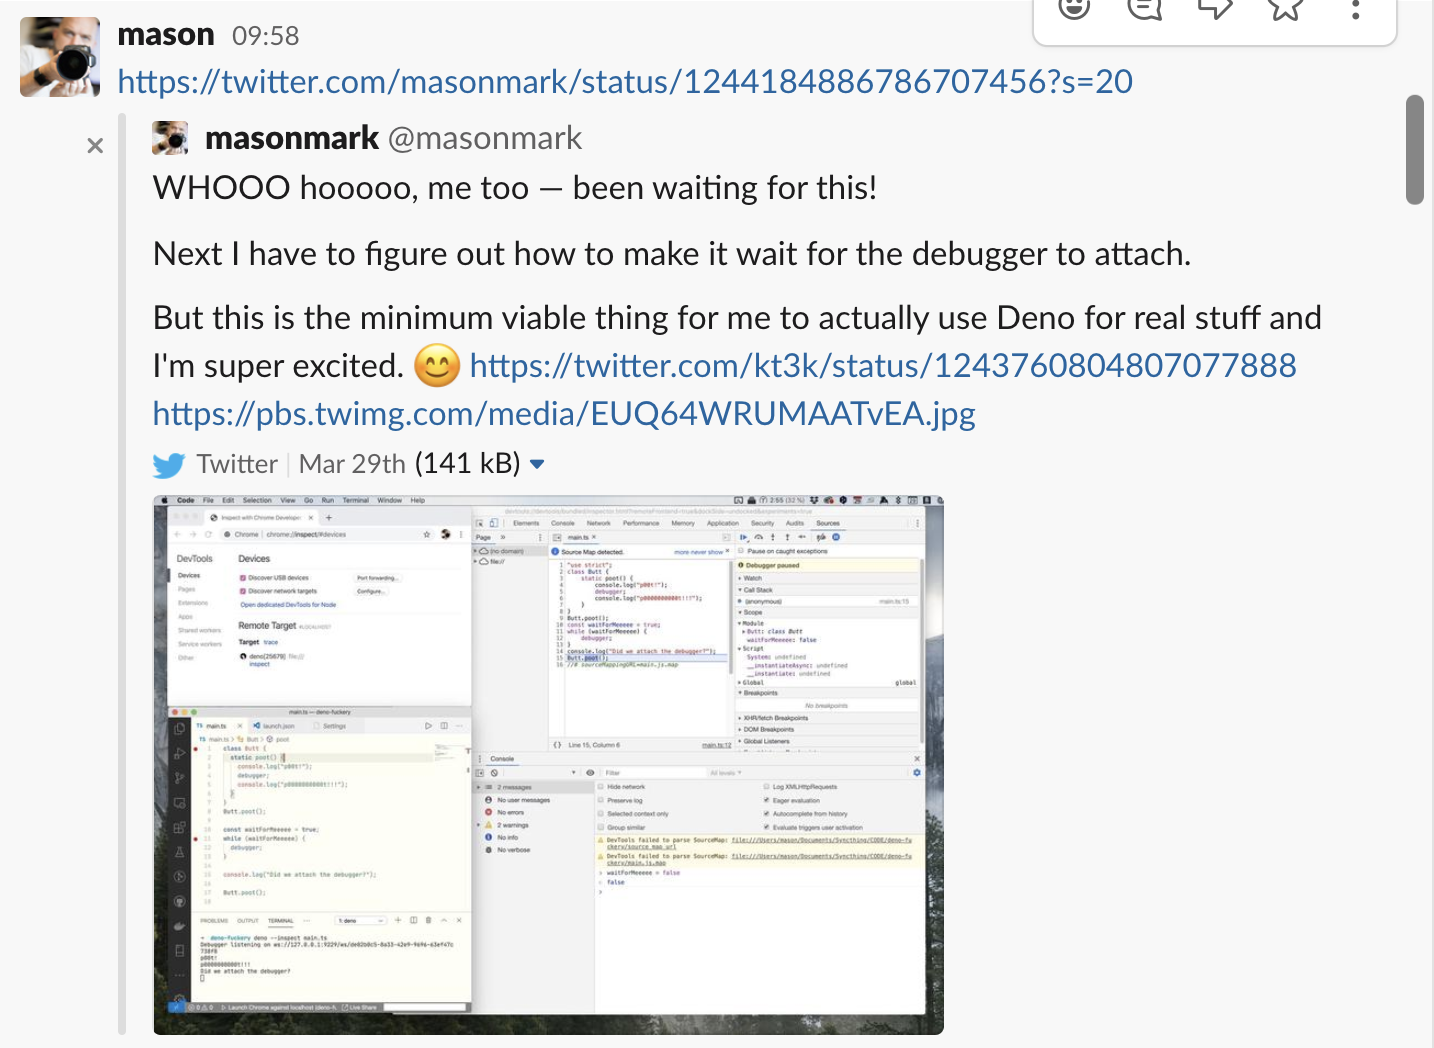
Deno recently added support for --inspect and there was much rejoicing. By me, I mean. On my work Slack. That rejoicing looked like this:

let us all rejoice!!!!!!!!!!!!

let us all REJOICE!!!!!!!!!!!!!!!!!!!!!!!!!!!!!!!!!!!!!!!!!!!!!!!!!!!!!
So *boom!* as we millennials say, around our mouthfuls of student-loan-financed 🥑🍞avocado toast, the PROBLEM IS FUCKING SOLVED AND I AM ON MY WAY TO EASY STREET!
Except... ew, why do I have to like use this grody Chrome thing?
I'm not like, writing some web application. I'm writing a cerified organic sustainably-farmed grass-fed serious, real, can totally deadlift 2.5x its own bodyweight app.
So I don't want to debug it in Chrome, and maybe I don't want to install that grotesque emblem of late-stage capitalism on my machine, even. I want to debug my program directly in VS Code!
And now I can! I AltaVista'd it today but I couldn't find anything that told me how to do that, so I just kept trying shit using the trial-and-error-plus-alcohol technique until I found the solution, which I converted into a 178-minute action movie featuring me as Idris Elba and him as me, so... enjoy! 👇🏻
For those people who were like um fuck off I'm not clicking your shitty video dude I will also explain it in words:
First, add an entry like this to your launch.json file:
{
  "version": "0.2.0",
  "configurations": [
    {
      "type": "node",
      "request": "attach",
      "name": "Deno debuggery",
      "port": 9229,
      "protocol": "inspector"
    },
  ]
}
Next, run your Deno program on the command line like so:
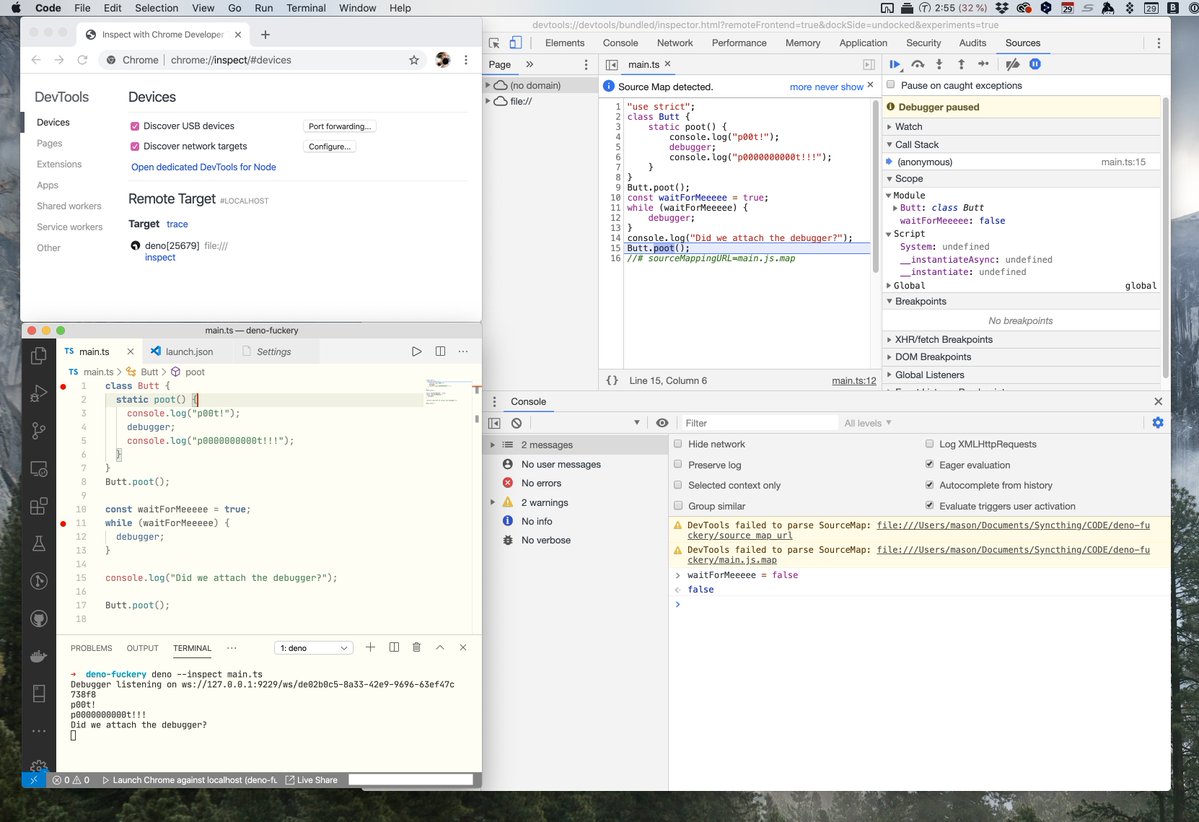
deno --inspect-brk main.ts
It will say something like Debugger listening on ws://127.0.0.1:9229/ws/c663d4b0-84f9-462f-ae37-fd79a73edd91. But it will be impatiently thinking, Hurry up and debug me, numbnuts!
So press F5 to debug it. 🥑🍞*boom!* You see the debugger stopped, saucily daring you to proceed. You haven't entered your program yet.
The final magic: step out, step out, step over. For reasons unknown to me, breakpoints set with VS code (the little red dots in the left margin of the code editor) will not be hit unless you do this little dance.
But if you do the dance, it will work. 🎉 LET US ALL REJOICE!! LET US ALL REJOICE!! 🎉
Debug your Deno program, and give the 🖕🏻to The Man!
KEYWORDS: Deno, code, TypeScript, your mom's booty
PREVIOUSLY:
 2020-03-31
  2019-11-23
  2018-11-26
  2018-06-17
  2018-06-17
  2013-07-01
  2013-05-01
  2012-12-18
  2012-11-14
  2012-03-16
  2012-01-17
  2011-12-31
  2011-12-29
  2011-12-25
  2011-12-12
  2011-12-05
  2011-11-11
  2011-10-12
  2011-10-12
  2011-09-28
  2011-08-10
  2011-07-14
  2011-06-14
  2011-05-30
  2011-04-03
  2011-03-23
  2011-03-09
  2011-02-12
  2011-01-14
  2010-12-25
  2010-11-03
  2010-09-15
  2010-08-25
  2010-08-01
  2010-05-15
  2010-05-11
  2010-04-26
  2010-04-18
  2010-04-18
  2010-04-06
  2010-04-04
  2010-01-13
  2010-01-09
  2009-10-15
  2009-08-03
  2009-07-06
  2009-07-01
  2009-06-15
  2009-05-18
  2009-05-13
  2009-04-21
  2009-04-18
  2009-04-14
  2009-04-11
  2009-03-25
  2009-03-19
  2009-03-13
  2009-03-06
  2008-11-23
  2008-11-05
  2008-11-02
  2008-10-25
  2008-09-23
  2008-08-20
  2008-07-18
  2008-07-11
  2008-06-03
  2008-05-14
  2008-05-12
  2008-04-08
  2008-04-04
  2008-04-01
  2008-03-21
  2008-01-29
  2007-12-05
  2000-12-03
  1979-11-20
 SUBSEQUENTLY:
 2020-11-02
  2021-02-23
  2021-08-02
  2022-02-18
  2024-09-10
  2024-10-26
  2024-11-04